End of Quarter Sale

Start the New Quarter with 70% Off Premium

2Days
13Hours
10Minutes
7Seconds
tiprankstipranks
70% OFF
Download the TipRanks App
Scan the QR code to download the appLearn more about the TipRanks app >>
Open App

‘Look for Exit Point,’ Says Investor About Micron and AMD Stocks

‘Look for Exit Point,’ Says Investor About Micron and AMD Stocks

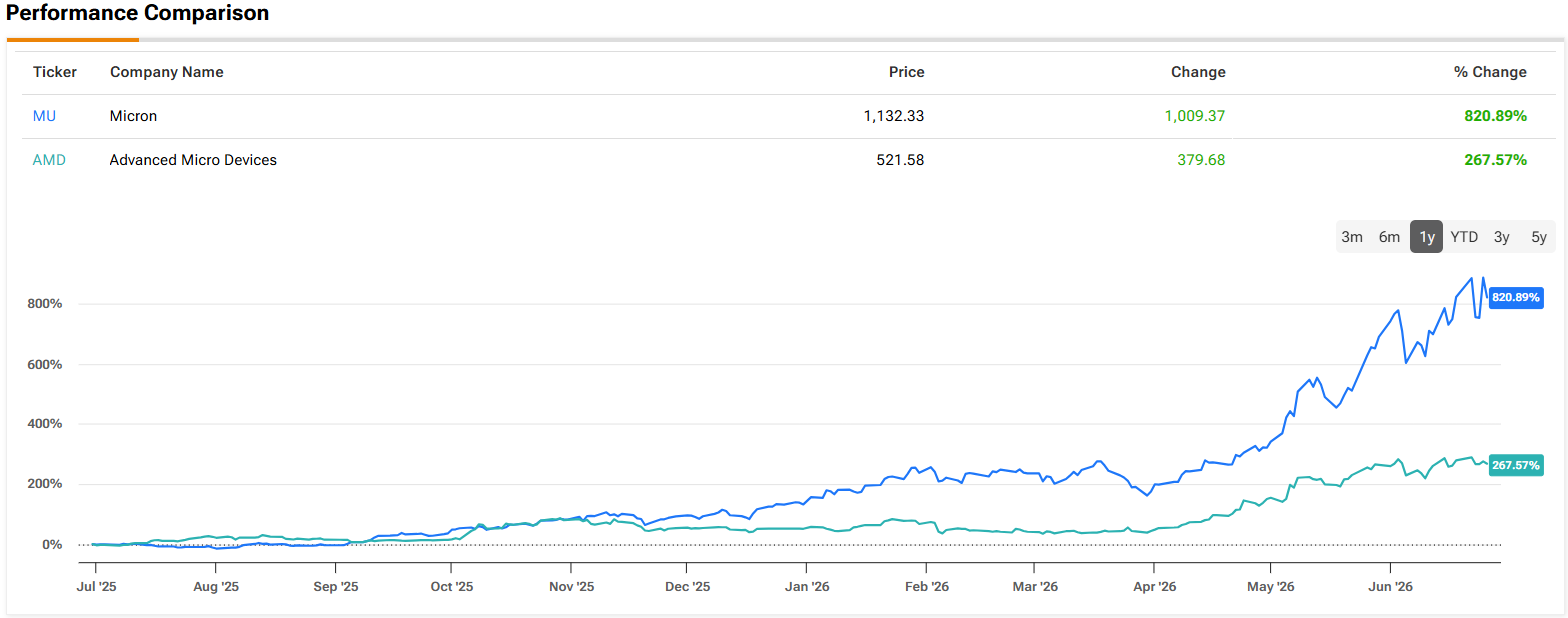
Over the past year, Micron (NASDAQ:MU) and Advanced Micro Devices (NASDAQ:AMD) have both stood out as AI winners, with the former benefiting from the AI-driven memory cycle and the latter gaining traction in AI GPUs and server CPUs.

End of Quarter Sale - 70% Off

These chipmakers’ real-world success has translated into huge share price gains, but the question is whether these stocks can sustain the momentum.

One investor, known by the pseudonym Value Portfolio (VP), believes the answer is a clear-cut no. VP takes a bearish stance toward both these AI stalwarts, considering the pair a Strong Sell. (To watch Value Portfolio’s track record, click here)

Starting with MU, the investor believes that despite “operational strength,” the stock is now “heavily overvalued, with risks tied to potential capacity expansions and market normalization.”

Referring to Micron’s recent earnings call, VP believes Micron’s most significant announcement was the introduction of new strategic customer agreements (SCAs), reflecting a shift toward longer-term arrangements during a period of constrained supply.

Micron’s supply agreements improve revenue visibility, but they also suggest to the investor that management expects the memory market to approach a ceiling as capacity expands around 2028–2029 and pricing normalizes. The long-term pricing commitments with major customers should reduce the urgency to secure supply at any cost, potentially limiting further price increases. So while the agreements provide several years of revenue certainty to support capital spending, the combination of rising capital expenditures and pricing floors below current levels suggests free cash flow could come under pressure if market prices decline.

“Our view is that a big reason why Micron is signing these SCAs is because they see the same thing we do, which is that with new fab capacity and consumer demand destruction, prices will cap out. The net result is we view Micron as a poor investment versus the S&P 500,” VP summed up.

As for AMD, VP says investors should stay away due to a combination of an “excessive valuation and intensifying custom silicon competition.”

AMD’s growth is being driven by its datacenter business, but reliance on mega-scale deals such as the one with Meta is not enough to support its multiple. Trading at nearly 170x earnings, the company requires “substantial profit growth,” yet there are indications that its largest customers may have limited capacity to keep increasing AI capex. For instance, Meta’s share price fell roughly 5% on reports it might finance tens of billions of dollars in additional AI spending through an equity offering. Even AMD’s recently announced $100+ billion agreement with Meta, averaging about $20 billion per year, still falls short of the growth implied by AMD’s current valuation.

At the same time, AMD faces competition in data centers not only from Nvidia but also from hyperscalers’ rapidly expanding in-house silicon efforts, with Google expanding its TPU program toward external commercialization and Amazon’s Trainium already exceeding $20 billion in annual revenue alongside roughly $225 billion in commitments.

“And in the coming years, we expect TPUs and custom silicon to put dramatically more pressure on margins and volumes,” VP summed up. “That will stop, in our view, AMD from ever growing into its present valuation.”

Accordingly, VP assigns AMD shares a Strong Sell rating.

However, the Street’s analysts appear to completely disagree, as both Micron and AMD earn Strong Buy consensus ratings. MU earns its rating based on 29 Buys and 1 Hold, with the average price target of $1,556.79 implying ~50% upside. AMD’s rating is backed by 28 Buys and 7 Holds, although its average target of $503.85 suggests little to no room for upside at current levels. That apparent disconnect likely reflects the stock’s rapid ascent rather than fading confidence, indicating analysts may raise their price targets as expectations catch up. (See AMD stock forecast or Micron stock forecast)

Disclaimer: The opinions expressed in this article are solely those of the featured investor. The content is intended to be used for informational purposes only. It is very important to do your own analysis before making any investment.

Disclaimer & DisclosureReport an Issue

Related Articles
Conversation0 Comments
Sort by
Your voice matters. Discussions are moderated for civility. Read our guidelines here.
Log in to join the conversation
No comments yet. Be the first to share your thoughts!
6

Bank of America Details How ‘Micron/Anthropic Partnership’ Locks In ‘Greater Confidence in 2-3-Year Supply/Demand/Pricing Visibility’

Story Highlights
  • Bank of America pointed to the Micron and Anthropic deal as proof that the memory chip market is gaining long-term price stability.
  • Big AI data center demand is on track to hit $1.7 trillion by 2030, helping the chip field add its next $1 trillion in sales in just five years.
Bank of America Details How ‘Micron/Anthropic Partnership’ Locks In ‘Greater Confidence in 2-3-Year Supply/Demand/Pricing Visibility’

Bank of America’s BAC +0.71% ▲ investment researchers put out a very positive update on the computer chip market on Monday. Five-star research analyst Vivek Arya led the study, showing that while the chip field took about 50 years to hit its first $1 trillion in sales, artificial intelligence will help add another $1 trillion in just the next five years. The bank explained that a major reason for this quick growth is a strong “Memory strength/durability, led by LTAs providing greater confidence in 2-3-year supply/demand/pricing visibility, as seen in recent MU/Anthropic partnership.”

End of Quarter Sale - 70% Off

The study shows that close ties between chip makers like Micron MU -7.39% ▼ and artificial intelligence labs change how the entire market works. Securing hardware supply early allows tech firms to map out their growth plans with much less worry.

Long Deals Give Micron Clear Views on Prices

The report shows that the new deal between Micron and Anthropic serves as a main example of how chip makers are planning out future hardware needs. These long-term agreements give Anthropic a much clearer look at its supply and prices for two to three years into the future. Having these steady deals helps stop the wild price drops that used to hurt Micron whenever the broader tech market slowed down.

Instead of buying chip hardware month by month, Anthropic is actively choosing to sign multi-year deals. This choice makes sure the AI firm has the physical hardware needed to train and run big artificial intelligence models like Claude, while giving Micron a highly steady stream of incoming cash.

Big Tech Demand Sparks Data Center Growth

The bigger force behind this recent deal is an ongoing demand for raw computing power across the technology world. Bank of America tracks show that the total market for AI data center systems will grow from $273 billion in 2025 up to a huge $1.7 trillion by 2030.

To keep up with these massive building plans, tech firms like Anthropic have to completely rethink how they get their hardware. The quick growth of new AI tools means data centers have to handle far more complex tasks than ever before. This deep change ensures that top-tier Micron memory chips will remain a vital piece of the tech puzzle, keeping the company in a position of real financial strength for years to come.

What Is the Price Target of MU Stock?

Turning to Wall Street, analysts have a Strong Buy consensus rating on Micron stock based on 29 Buys and one Hold assigned in the past three months. MU’s average stock price target of $1,538.93 per share implies a 36% upside potential. (See the MU stock forecast)

Disclaimer & DisclosureReport an Issue

Related Articles
6

Top BofA Analyst Defends Micron Stock’s ‘Chip Super-Cycle’ as ‘$1.0 Trillion Run-Rate’ Defeats New ‘Memory Tax’

Story Highlights
  • Five-star analyst Vivek Arya kept a “Buy” rating on Micron stock and raised the official price target to $1,550 per share.
  • BofA expects the global memory industry to hit an “annual run rate also US$1.0tn” to easily absorb the rising AI “memory tax.”
Top BofA Analyst Defends Micron Stock’s ‘Chip Super-Cycle’ as ‘$1.0 Trillion Run-Rate’ Defeats New ‘Memory Tax’

Bank of America BAC +0.73% ▲ investment researchers came out with a highly bullish report on Micron stock MU -7.32% ▼ on Monday, telling clients that the global computer chip shortage could run all the way into 2027 or even 2030. Five-star research analyst Vivek Arya led the study, officially keeping a “Buy” rating for Micron stock. Furthermore, Arya raised his official price target for the company up to $1,550 from his previous $1,500 estimate.

End of Quarter Sale - 70% Off

This major price target bump for Micron stock comes even though the firm noted that high chip prices are starting to put a heavy financial burden on data center clients. Vivek Arya described this growing economic pressure as a “memory tax” that now takes up roughly 35% of all artificial intelligence capital spending. However, the report shows that the positive forces pushing the chip sector forward are much stronger than this headwind, as the broader market points toward an implied “annual run rate also US$1.0tn)” for the global memory space.

Five-Year Customer Agreements Protect Micron Stock

The main reason behind the positive view on Micron stock is the company’s new strategy to lock in long-term sales deals. The firm has successfully signed 16 strategic customer agreements that feature rigid take-or-pay rules alongside strict price floors and ceilings. These five-year deals run from 2026 through 2030 and are expected to bring in at least half of the company’s total sales revenue.

Vivek Arya pointed out that these special long-term deals give Micron stock an unprecedented amount of demand visibility. By fixing prices in advance, the chip giant can protect its profit margins and ensure it keeps making money without facing severe price competition from rival firms. This structure changes the entire business model, shifting the company away from old market patterns where chip prices would wildly crash after a big boom.

Rocketing Cash Flows Spark Talk of MU Stock Buybacks

The huge jump in artificial intelligence chip shipments is also creating an incredible amount of cash for the business. Bank of America data shows that Micron’s AI chip shipments for 2026 have already more than doubled since 2024. This growth is being driven by new advanced tech systems like agentic AI that need vast amounts of data storage to function.

As a result, Vivek Arya expects the firm’s free cash flow margins to head toward the 50% to 60% range over the coming years. This surge in incoming cash gives the company immense freedom to return money to its everyday investors. The report notes that even if management sets aside a massive $32 billion for a potential share buyback program in 2027, this giant sum would still only take up a small 25% piece of the total free cash the company is expected to generate.

What Is the Price Target of MU Stock?

Turning to Wall Street, analysts have a Strong Buy consensus rating on Micron stock based on 29 Buys and one Hold assigned in the past three months. MU’s average stock price target of $1,538.93 per share implies a 36% upside potential. (See the MU stock forecast)

Disclaimer & DisclosureReport an Issue

Related Articles
6
Sponsored Content

Most of the Fastest Growing Companies Are Not in the S&P 500: How the Golden Eagle Dynamic Hypergrowth ETF is Built to Capture Them

Story Highlights

Growth investing has rarely been this concentrated. The question for advisors is no longer whether their portfolios should hold growth, it is whether they should hold the same handful of mega-caps as everyone else. A new ETF is built around a measurable segment of the market that conventional growth screens tend to miss entirely.


Most of the Fastest Growing Companies Are Not in the S&P 500: How the Golden Eagle Dynamic Hypergrowth ETF is Built to Capture Them

As of June 8, 2026, the so-called Magnificent Seven accounted for roughly 33.8% of the S&P 500, and the ten largest companies in the index made up close to 39% of its total market capitalization, among the highest concentration levels in the index’s modern history.¹ For advisors building growth allocations, that creates a quiet problem: a portfolio meant to capture innovation can end up resting on a handful of the same names.

A small segment of the market typically falls outside that concentration, defined by a single measurable trait. Hypergrowth Stocks are companies posting year-over-year revenue growth of 40% or more. According to research from Golden Eagle Strategies, these companies have represented only about 2% of the S&P 500 and roughly 5% of the Nasdaq 100 on average between 2009 and 2025.² The Golden Eagle Dynamic Hypergrowth ETF HYP -0.17% ▼ , which carries a TipRanks Analyst Consensus of Moderate Buy, is built to target that segment systematically.³ Past performance does not guarantee future results.

¹ Source: The Motley Fool, market-concentration data, as of June 2026.

² Source: Golden Eagle Strategies research, Bloomberg-sourced, 2009 to 2025 averages.

³ Source: TipRanks, Golden Eagle Dynamic Hypergrowth ETF (HYP) Smart Score page, as of 6/9/2026.

What Are Hypergrowth Stocks, and Why Do Conventional Screens Miss Them?

The defining feature of a Hypergrowth Stock is objectivity. A company either grows revenue by 40% or more year over year, or it does not. The concept itself is not new: it traces to a 2008 Harvard Business Review article on managing hypergrowth, and was later formalized by the World Economic Forum, which in a 2016 report with Ernst & Young described hypergrowth as compound annual growth above 40%.⁴ What Golden Eagle added was a rules-based way to measure it across the whole U.S. market in real time.

The harder question is why these companies might stay under-owned even after a decade of attention. Golden Eagle’s research points to several structural reasons. Market-cap-weighted indices tend to include companies only after they have already scaled, so much of the steepest growth happens before a name becomes a meaningful index constituent. Passive strategies inherit that benchmark constraint. Conventional screens built around price-to-earnings ratios and forward earnings are misaligned with companies prioritizing top-line acceleration over near-term profit, so many hypergrowth names are filtered out before an analyst ever looks at them. And because hypergrowth leadership rotates across sectors and market caps from quarter to quarter, capturing it requires active repositioning that index funds are not built to do.

Golden Eagle’s research, drawn from approximately 250,000 stock-performance periods dating back to 2009, also quantifies the historical reward for owning the segment. The firm’s study found that U.S.-listed companies with revenue growth above 40% delivered an annualized return of about 43% from 2009 to 2025, compared with roughly 15% for the broader S&P 500 over the same period.⁵ Those figures are retrospective and illustrative of the asset class studied, not a representation of any fund’s performance, and past results do not predict future returns. What they do illustrate is why a measurable, rules-based definition of hypergrowth can be a useful lens for the part of a growth allocation that is hardest to reach.

⁴ Source: Harvard Business Review, “Managing Hypergrowth,” April 2008; World Economic Forum, “Mastering Hypergrowth,” April 2016.

⁵ Source: Golden Eagle Strategies Hypergrowth Trend Report, March 2026, Bloomberg-sourced, 2009 to 2025.

Hypergrowth Rotates Across the Economy, Not Just Tech

The most common misconception about hypergrowth is that it lives only in technology. The data from 2025 tells a different story. Across Golden Eagle’s hypergrowth universe last year, the Materials sector nearly doubled its share of qualifying companies, while Energy also climbed as power demand from data centers grew.⁶ At the industry level, the number of hypergrowth companies in Metals and Mining went from a single name at the start of 2024 to sixteen by the end of 2025, fueled by strength in gold and silver, while the Software sector’s hypergrowth count rose from five to sixteen as the focus shifted toward AI infrastructure.⁶

That rotation is visible in how the Golden Eagle Dynamic Hypergrowth ETF actually looks today. Its current holdings span semiconductors and memory, optical networking, infrastructure, energy, biotech, and space, rather than clustering in a single theme.⁷ Recent market activity has reflected that breadth. TipRanks reported a Micron-led rally that drove a 13x volume surge in HYP, and a separate note covered Mizuho raising price targets across the AI-memory names the fund holds.⁸ The screen is built to surface fast-growing companies wherever the growth is occurring, not where it has already been rewarded.

⁶ Source: Golden Eagle Strategies Hypergrowth Trend Report, March 2026.

⁷ Source: Golden Eagle Dynamic Hypergrowth ETF holdings, as of 6/8/2026.

⁸ Source: TipRanks, “Micron-Led Rally Drives 13x Volume Surge in HYP ETF” and “Mizuho Raises Price Targets for AI Memory Stocks,” as of June 2026.

Inside the Portfolio: Three Holdings That Show the Range

HYP holds 60-80 names, weighted toward roughly equal weight so no single position dominates, and the book reads as a cross-section of where revenue is accelerating across the economy. Three current holdings as of June 2026 illustrate the spread. Holdings are subject to change. For the fund’s complete current holdings, visit hypergrowthetf.com.

Western Digital Corporation WDC +3.33% ▲ , the AI memory upcycle. Western Digital sits in the storage and memory complex that has re-rated as AI workloads drive demand for high-capacity drives. The stock carries a TipRanks Strong Buy consensus based on 16 Wall Street analysts, with an average 12-month price target of $548.31, representing roughly 47% upside from its recent price.⁹

Sterling Infrastructure STRL +0.90% ▲ , the data-center buildout. Sterling provides the site development and infrastructure work that data-center and large-scale construction depend on, putting it on the physical side of the same AI buildout. It holds a TipRanks Strong Buy consensus from 6 analysts, with an average price target of $928.00.¹⁰

Applied Optoelectronics AAOI -1.38% ▼ , optical connectivity. Applied Optoelectronics builds the optical transceivers that move data inside AI data centers, a corner of the supply chain seeing demand growth as hyperscalers expand capacity. The stock carries a TipRanks Moderate Buy consensus from 5 analysts, with an average price target of $151.30.¹¹

None of these is a mega-cap benchmark name, which is a key point. The screen is designed to find companies in the steep part of their growth curve across different sectors, not to mirror the concentration that already dominates most growth allocations.

⁹ Source: TipRanks, Western Digital Corporation (WDC) analyst forecast, as of 6/9/2026.

¹⁰ Source: TipRanks, Sterling Infrastructure, Inc. (STRL) analyst forecast, as of 6/9/2026.

¹¹ Source: TipRanks, Applied Optoelectronics, Inc. (AAOI) analyst forecast, as of 6/9/2026.

Four Steps in the Hypergrowth Screen

What distinguishes HYP from a conventional growth ETF is less the universe it considers and more the disciplined process it applies. The methodology runs in a repeating monthly cycle.

Daily Universe Scan. The process starts wide, evaluating thousands of U.S.-listed companies, including ADRs, every day. Rather than starting from an index, the screen assesses each company on revenue trajectory, growth velocity, and liquidity, casting a far broader net than a benchmark-based strategy would.

The 40% Threshold. From that universe, the screen isolates companies meeting the objective hypergrowth qualification: year-over-year revenue growth of at least 40% in the latest reported quarter. Liquidity and revenue-scale filters screen out thinly traded or micro-scale names, leaving a defined universe of genuine hypergrowth businesses rather than statistical noise.

Multi-Sector Construction. Qualifying companies are assembled into a portfolio of 60-80 holdings, balanced for liquidity and concentration and weighted to avoid overexposure to any single name. Because the screen carries no sector or market-cap bias, the resulting book reflects wherever hypergrowth is actually occurring.

Monthly Rebalance. Hypergrowth leadership rotates, so the fund re-runs the screen and repositions monthly. Companies that have decelerated below the threshold roll off, and newly qualifying names roll in, keeping the portfolio aligned with current growth leadership rather than a snapshot from a year earlier.

The fund trades on the Nasdaq, launched on September 23, 2025, carries an expense ratio of 0.85%, and is classified as non-diversified, with net assets of approximately $67.36 million as of June 22, 2026.¹² “HYP’s portfolio will include 60 to 80 names,” said Robert Zuccaro, CFA, Founder and Chief Investment Officer of Golden Eagle Strategies, at launch. “What it won’t include is overexposure to the legacy benchmarks or ‘Magnificent 7.’ Investors are already typically overexposed to those types of investments. It’s time to start a new conversation about where many investors should be seeking growth.”¹³

¹² Source: Golden Eagle Dynamic Hypergrowth ETF fund page market data, as of 6/22/2026.

¹³ Source: Golden Eagle Strategies launch press release, September 23, 2025.

Where Hypergrowth Can Fit in a Growth Allocation

Golden Eagle characterizes hypergrowth as a measurable, persistent, and structurally under-owned segment of the equity market. It shows up across sectors and market caps, it rotates over time. As such it can be routinely filtered out by the benchmarks and valuation screens that shape most growth allocations. The Golden Eagle Dynamic Hypergrowth ETF seeks to offer one approach to that segment: a systematic, rules-based screen that identifies companies posting 40% or greater revenue growth and rebalances monthly to follow that growth wherever it moves, resulting in exposure that complements rather than duplicates mega-cap-heavy core holdings.

Investors considering HYP should weigh the fund’s limited operating history as a recently launched ETF, the concentration risk inherent in a focused, non-diversified portfolio, and the model and growth-style risks that come with a quantitative strategy targeting high-growth companies, which can be more volatile than the broader market. Depending on an investor’s risk tolerance and time horizon, a hypergrowth allocation may complement a broader growth sleeve, but it is not a substitute for diversification across asset classes and sectors. Past performance does not guarantee future results. Investors should consider their own financial situation, investment objectives, and risk tolerance before investing.


Disclosures

This article is sponsored content created in partnership with Golden Eagle Strategies. It is intended for informational and educational purposes only and does not constitute investment advice, a recommendation, or a solicitation to buy or sell any securities. Investors should consider their own financial situation, risk tolerance, and investment objectives before making any investment decisions. Investing involves risk, including the possible loss of principal.

The performance data quoted represents past performance. Past performance does not guarantee future results. The investment return and principal value of an investment will fluctuate so that an investor’s shares, when sold or redeemed, may be worth more or less than their original cost and current performance may be lower or higher than the performance quoted. Performance current to the most recent month-end can be obtained by calling 855.994.4866. Short term performance, in particular, is not a good indication of the fund’s future performance, and an investment should not be made based solely on returns.

The TipRanks Smart Score, Analyst Consensus, and price target figures referenced for HYP and its holdings are third-party data from TipRanks as of the dates noted. For ETFs, TipRanks calculates the Analyst Consensus and price target as the weighted average of the fund’s holdings plus additional factors. These figures are not a recommendation and do not represent the views of the Fund or its adviser.

The Fund’s investment objectives, risks, charges, and expenses must be considered carefully before investing. The prospectus [BZ10] and summary prospectus contain this and other important information about the investment company, and they may be obtained by calling 855.994.4866 or visiting hypergrowthetf.com/hyp-etf. Please read the prospectus carefully before investing.

Investing involves risk, including the possible loss of principal. As an ETF, the Fund’s shares may trade at a premium or discount to NAV. Shares of ETFs are bought and sold at market price (not NAV) and are not individually redeemed from the Fund. Brokerage commissions and bid-ask spreads may reduce returns. There is no guarantee that the Fund’s investment strategy will be properly implemented, and an investor may lose some or all of its investment. The Fund, the Trust, the Adviser, the Sub-Adviser, and their respective affiliates make no representation as to the performance of any index. The Fund, Trust, Adviser, and Sub-Adviser are not affiliated with, nor endorsed by, any index.

ETF Structure Risk. The market price of the Fund’s shares will fluctuate in response to changes in NAV and supply and demand. Shares may trade at a discount or premium to NAV, and an active trading market may not develop or be sustained. Trading of the Fund’s shares on the exchange may be halted due to market conditions. Authorized Participants, market makers, and liquidity providers are not obligated to engage in creation and redemption activity, and the Fund may trade at a discount if they exit the business.

Equity Market Risk. Stock prices fluctuate, sometimes rapidly and unpredictably. The Fund may be affected by company-specific events, market conditions, or overall economic factors. Growth Style Risk. Growth stocks may be more volatile and more sensitive to earnings disappointments and may underperform other investment styles or the market as a whole. Small- and Mid-Cap Risk. Securities of smaller companies may experience more abrupt or erratic movements than those of larger, more established companies.

Foreign Securities and ADR Risk. The Fund may invest in ADRs and foreign securities, which involve additional risks, including currency fluctuations, political and economic instability, and differences in regulatory and accounting standards.

Quantitative Model Risk. The Adviser relies on proprietary models that may not perform as expected due to incorrect assumptions, inaccurate data, or unforeseen market conditions. Cybersecurity Risk. Failures or breaches of electronic systems at the Fund, Adviser, Sub-Adviser, or service providers could result in financial losses or operational disruptions. Management Risk. The Fund is actively managed, and the Adviser’s decisions may not produce the desired results. As a newly formed adviser, its limited operating history may present additional risks.

New Fund Risk. The Fund is recently organized, has no operating history, and currently has fewer assets than larger funds. As with other new funds, large inflows and outflows may impact market exposure for limited periods of time.

Diversification Risk. Diversification does not ensure a profit or protect against loss in a declining market.

The Fund defines a company as a “Hypergrowth Stock” if it has year-over-year revenue growth of at least 40% in the latest reported fiscal quarter.

For full fund details and the most recent prospectus, visit https://hypergrowthetf.com/hyp-etf/.

The Golden Eagle Dynamic Hypergrowth ETF is distributed by Foreside Fund Services, LLC.


Disclaimer & DisclosureReport an Issue

Related Articles
6

Top Analyst Lifts Micron Stock Price Target by 250%+ as Memory Prices Surge

Story Highlights

• MU stock is up by more than 290% year-to-date.
• Phillip Securities raises its price target on Micron stock, citing higher DRAM and NAND prices.

Top Analyst Lifts Micron Stock Price Target by 250%+ as Memory Prices Surge

Micron Technology MU -7.32% ▼ delivered a solid earnings report last week, easily beating Wall Street expectations. Adding to the bullish outlook, five-star-rated analyst Yik Ban Chong of Phillip Securities raised his price target on MU stock by 252%, from $530 to $1,870, while maintaining a Buy rating. The new target implies about a 65% upside from the current share price. Chong expects the memory chip shortage to continue beyond 2027, which should keep DRAM and NAND prices rising and support stronger profits.

End of Quarter Sale - 70% Off

For context, Micron makes NAND chips for long-term storage like SSDs and smartphones, and DRAM chips that act as fast working memory in computers and data centers. The company reported adjusted earnings per share (EPS) of $25.11, well above Wall Street’s estimate of $20.83. Meanwhile, revenue came in at $41.46 billion, beating analyst expectations of $35.85 billion.

Analyst Sees Bigger Gains as Memory Prices Climb

Chong noted that Micron’s third-quarter results were in line with the analyst’s expectations, driven by higher memory chip shipments and a big jump in DRAM and NAND prices. Chong also increased forecasts for Micron’s 2027 revenue and earnings. He lifted revenue forecast by 16% and PATMI (Profit After Tax and Minority Interests) forecast by 23%.

He also highlighted Micron’s 16 signed long-term supply agreements with customers, which are worth about $100 billion. He believes these agreements highlight strong demand as the memory chip market remains supply-constrained.

The analyst pointed out that DRAM prices jumped about 215% year-over-year, while NAND prices surged about 272% in the latest quarter. Meanwhile, supply remains tight because building new chip factories takes 2–4 years, and available production space is still limited. As a result, customers are focusing more on securing guaranteed supply rather than negotiating lower prices. They are also signing longer contracts of 3–5 years, instead of the usual one-year deals.

Chong Updates Micron’s Valuation

Chong updated his valuation approach and now assumes Micron will trade at 14 times expected FY27 earnings, compared to 9 times FY26 earnings earlier. This means he is valuing the company at a higher earnings multiple going forward. However, this is still a 52% discount compared to other chip companies, which trade at an average of 29 times forward earnings. This is because most of Micron’s business is still exposed to cyclical demand from areas like smartphones, PCs, and cars.

Overall, Chong stated that as Micron signs more long-term supply agreements, its earnings are expected to become more stable. This could reduce volatility and help the stock get a higher valuation from investors in the future.       

What Is the Price Target of MU Stock?

Turning to Wall Street, analysts have a Strong Buy consensus rating on Micron stock based on 29 Buys and one Hold assigned in the past three months. MU’s average stock price target of $1,538.93 per share implies a 36% upside potential.


Disclaimer & DisclosureReport an Issue

Related Articles
6

Nasdaq and S&P 500 Futures Rise as Tech Stocks Bounce Back. What’s Driving the Surge?

Story Highlights
  • U.S. stock index futures rose on Monday morning, with tech-heavy Nasdaq-100 contracts gaining 1.2% after a sharp market drop.
  • Early buying in chip shares and a fast-track index update for SpaceX helped lift both S&P 500 and Dow futures contracts.
Nasdaq and S&P 500 Futures Rise as Tech Stocks Bounce Back. What’s Driving the Surge?

U.S. stock index futures turned green on Monday morning as technology shares started to bounce back from a rough week. While a fragile peace deal between the U.S. and Iran kept the oil market on edge, equity buyers shifted their attention back to major tech names. This return of market buyers helped lift broad index contracts across the board, setting a positive tone for the start of the week’s trading.

End of Quarter Sale - 70% Off

SPCX has a long & short ETF? Explore SPCM & SPCG

The upward move comes right after a sharp market drop that shook investor confidence in tech stocks last week.

Nasdaq-100 Futures Lead the Monday Rebound

The technology-dense Nasdaq-100 (NDX) futures contract led the morning gains, climbing 1.2% in early trading. This major index future found strong support as investors rushed back into hardware and chip design shares during premarket hours. Individual tech firms like Arm Holdings ARM -4.42% ▼ and Intel INTC -5.07% ▼ saw a rise in buying interest, which directly powered the tech index higher and helped reverse a large portion of the losses from the previous week.

S&P 500 Futures Gain Ground on Corporate Growth News

The broad-market S&P 500 (SPX) futures contract ticked up 0.8% as investors picked up shares across multiple industries. Memory chip maker Micron Technology MU -7.29% ▼ and a massive 25% surge from Comcast CMCSA +8.93% ▲ helped give the index a healthy boost. At the same time, news that Elon Musk’s satellite firm SpaceX SPCX +1.05% ▲ will get fast-tracked into the main tech index next month brought extra excitement to the broader market, drawing more cash into the S&P 500 contracts.

Dow Jones Futures Edge Higher Despite Global Oil Anxiety

The Dow Jones Industrial Average DJIA +0.41% ▲ futures contract climbed 188 points, or 0.4%, trailing the tech indexes but still showing steady growth. Dow buyers had to weigh the morning stock bounce against ongoing worries about global energy supplies, as international crude prices crept up past $72 a barrel.

Even with those oil supply fears keeping some investors cautious, the lack of immediate political fighting allowed the blue-chip index futures to hold onto their morning gains.

Disclaimer & DisclosureReport an Issue

Related Articles
6

Latest News Feed

William White

Southwest Airlines Stock (LUV) Slips on Route Cuts

Ran Melamed

“Ready to Tiqk Higher”: Wedbush Says INFQ Stock Can Jump 56%

Eddie Pan

The Two Trillion-Dollar Stock Set to Join the Nasdaq 100

Annika Masrani

Bank of America Details How ‘Micron/Anthropic Partnership’ Locks In ‘Greater Confidence in 2-3-Year Supply/Demand/Pricing Visibility’

Shalu Saraf

‘Time to Buy,’ Says Analyst About Roblox Stock; Shares Surge 13%+

Kirti Tak

SpaceX Stock Forecast — Nasdaq-100 Inclusion Could Change Everything for SPCX

Solomon Oladipupo

Bloom Energy Stock (BE) Jumps 10% after Selloff, Defying Wells Fargo’s Hold Call

Ran Melamed

IONQ, XNDU,HQ, QUBT, RGTI, and QBTS: Which Quantum Computing Stock Looks Best?

Eddie Pan

Dow Jones Gains as U.S. and Iran Move to Resume Peace Talks

Shalu Saraf

Nvidia vs. Qualcomm: Bernstein Chooses the Top Robotics AI Stock to Buy

William White

Why Is Penny Stock Universe Pharmaceuticals (UPC) Up Today?

Joy Iyke

Anthropic Nets a Half-Win as U.S. Reopens Mythos 5, but Keeps Fable 5 Blocked

Hillary Remy

Helium’s Network Is Growing. Its Token Is Not

David Craik

M&A News: Martin Marietta Materials Scoops Up Peer Lhoist North America in $13.5B Deal

Annika Masrani

Top BofA Analyst Defends Micron Stock’s ‘Chip Super-Cycle’ as ‘$1.0 Trillion Run-Rate’ Defeats New ‘Memory Tax’

Samuel AI
Ask anything about your portfolio or the market
Let's chat!
AI-generated responses are not investment advice and may contain errors.